We live in a data-driven world. Every day, we are bombarded with numbers, statistics, and charts. But how can we make sense of all this data?
That's where data visualization comes in. Data visualization is the art of turning numbers into stories. It's a powerful tool for communicating insights and making better decisions.
With data visualization, you can:
Communicate insights to your team, stakeholders, and customers in a clear and concise way.
Reveal trends and patterns that would be invisible to the naked eye.
Make better decisions by seeing the data in a new light.
Inspire others and help them see the world in a new way.
But data visualization is more than just making charts and graphs. It's about using visuals to tell a story that engages and informs your audience.
The right data visualization can:
Grab attention and hold it.
Break down complex information into easy-to-understand concepts.
Elicit an emotional response.
Motivate people to take action.
If you want to be a more effective leader, decision-maker, or communicator, then you need to learn data visualization.
Here are some of the key benefits of data visualization:
Improved communication: Data visualization can help you communicate your ideas and findings more effectively. It can make your data easier to understand and remember, and it can help you to connect with your audience on an emotional level.
Better decision-making: Data visualization can help you to make better decisions by providing you with a clear and concise overview of your data. It can help you to identify trends and patterns, and it can help you to see the big picture.
Increased productivity: Data visualization can help you to save time and improve your productivity. It can help you to automate tasks, and it can help you to identify areas where you can improve your processes.
Enhanced creativity: Data visualization can help you to be more creative. It can help you to see your data in new ways, and it can help you to come up with new ideas.
Here are some of the key challenges of data visualization:
Choosing the right tool: There are many different data visualization tools available, and it can be difficult to choose the right one for your needs.
Making your data understandable: It's important to make sure that your data visualization is easy to understand for your audience. You need to choose the right visuals and use clear and concise language.
Telling a story: Data visualization is not just about making your data look good. It's also about telling a story with your data. You need to use your visuals to communicate your message in a way that is clear and engaging.
Here are some tips for creating effective data visualizations:
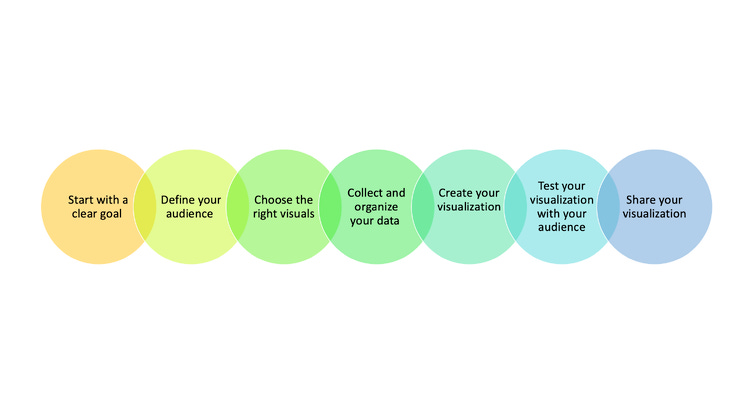
Start with a clear goal: What do you want your data visualization to achieve? Once you know your goal, you can start to choose the right visuals and data.
Keep your audience in mind: Who is your audience? What do they need to know? Make sure that your data visualization is tailored to your audience's needs.
Use clear and concise language: Avoid using jargon or technical terms that your audience may not understand.
Use visuals that are relevant and engaging: Choose visuals that will help you to communicate your message effectively.
Test your visualization with your audience: Before you share your data visualization, make sure to test it with your audience to make sure that it is easy to understand.
What are your thoughts on data visualization? How has it helped you in your work?
#datavisualization #datascience #dataviz #datadriven #inspiration #leadership #innovation #business #marketing #communication #education #research


